If you aren’t taking advantage of your cameras histogram then you are leaving too much to chance. The histogram allows you to tell if your photograph is over or underexposed in a way that viewing it on your tiny little LCD screen just can’t. If you learn how to use your histogram you wont make the mistake of heading home after a day of photographing squirrley squirrels doing what squirrels do only to find out that all your pictures were underexposed under the thick canopy of trees in the forest.
What am I looking at?
The histogram, from left to right, shows us black to white color tones of your photograph. The more dark pixels your photograph has the more skewed to the left the histogram will be, the more white pixels the more skewed to the right it will be. If your photograph has a cluster of pixels on the right side of the histogram then your picture will be very bright (snow, sunny beach, etc.). If you have a bunch of pixels on the left side then you will have a photograph with a lot of dark colors in it (sunset, shadows, etc). Taking a photograph of a silhouette will create spikes on both sides of your histogram, while this is not usually desired in everyday photographs, this is probably exactly what you are trying to achieve with a silhouette.
Perfect Histogram
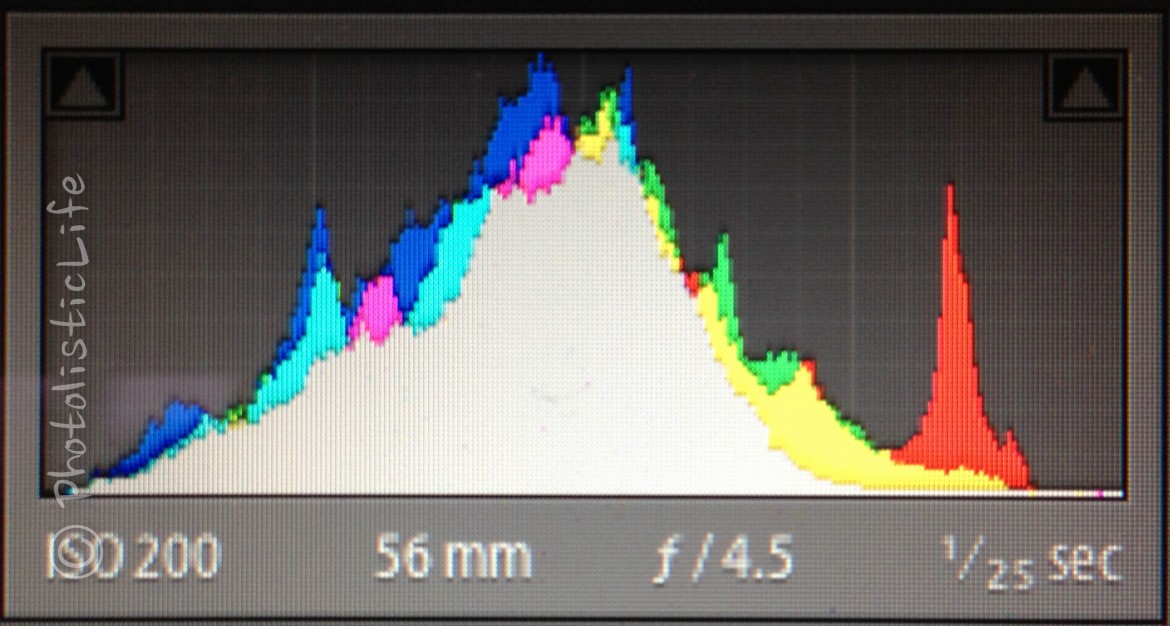
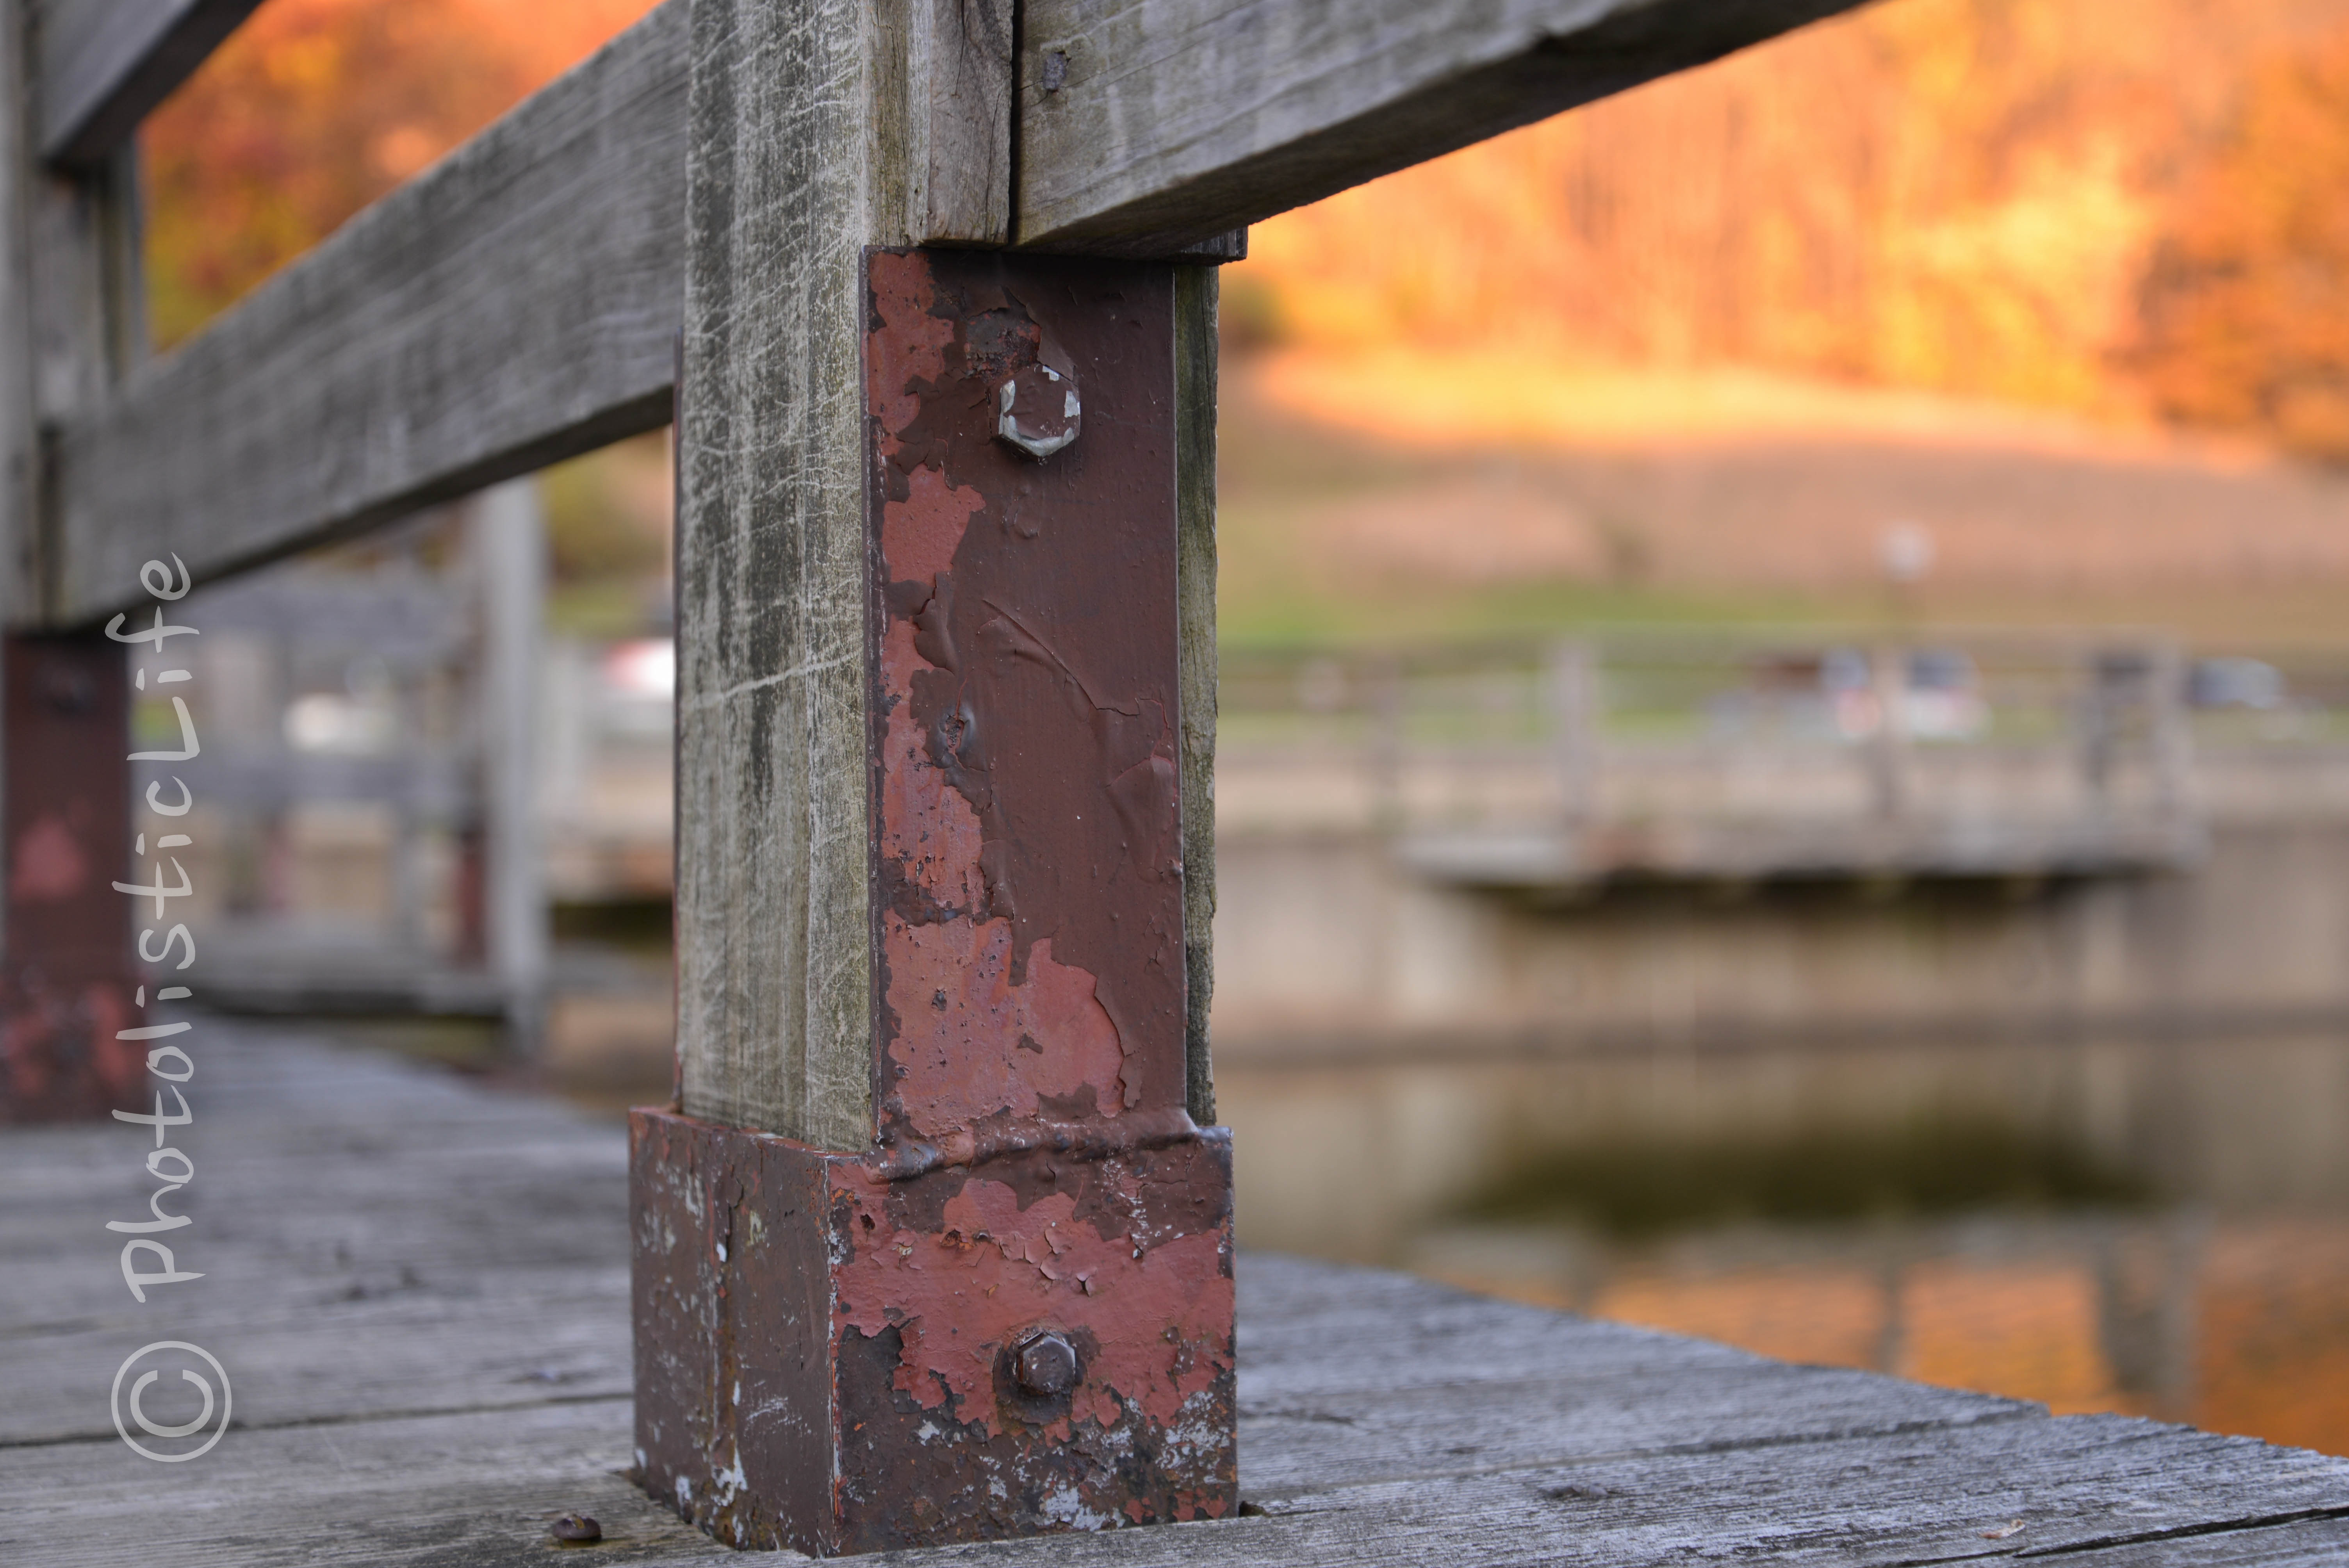
There is, unfortunately, no perfect histogram because as you photograph you are using your creative judgement and something less than “perfect” might be exactly what you’re looking for. For a photograph that has a nice even balance of colors (white or black isn’t blown out) and limited loss of detail you’ll want to strive for a histogram similar to the one at the top of the page, the histogram peaks around the middle and tapers off the right and left sides (the photo below is the owner of this histogram).
Conclusion
Great! So now you know what you’re looking at and can dazzle all your less knowledgeable photog friends with your new-found understanding. Here are some final tips.
- If your histogram is skewed strongly to the right or left your photograph may be over or under exposed and there is some lost detail in the white or black (or both) pixels.
- Set your camera to show the histogram for a little more detail after each shot to reduce the chances of not getting the “perfect” shot.
- Just because your histogram is skewed to one side or the other doesn’t mean the loss of detail is in an important area, use the histogram as a reference and a warning that you may need to review and make sure the loss of detail is acceptable.
Related Links
How to Take Sharper Photographs
How to Use the White Balance Settings on your Camera
What is Light Metering?
Easy Graph to Learn Aperture, ISO, and Shutter Speed
Simple Guide to Using your Camera in Manual Mode


Good information, John. I remember in a class that I took there was one student who could not wrap their head around what the histogram represented. This person kept insisting that the histogram was a linear representation of the photo, ie the left side of the histogram gave information about the left side of the photo and on across the photo. They had a hard time grasping that the histogram left to right represented shadows – midtones – highlights and was a representation of ALL the shadows (dark pixels) and ALL the highlights (light pixels) and ALL the mid-tones (medium pixels) throughout the photo. In your example, the mid-tones (represented by the center of the graph) were the overriding pixels in the photo with a tapering off on the left (shadow side) and right (highlight side) in an almost perfect manner!! The spike on the highlight side represents that very bright area but NOT because it is on the right side of the photo; that spike would have occurred on the highlight side of the histogram (right) if the brightest spot had been on the left side of the photo. Well, now that I have sufficiently muddied the waters, I will sign off!!
Thanks! Yes, it can be quite confusing, but it sounds like you have it mastered. It’s rather helpful once you know what your looking at.